When it comes to drunk driving accidents in North Carolina, not all counties are created equal.
While the state as a whole has a relatively low percentage of drunk driving accidents, the actual numbers vary wildly across the state. Using data from UNC’s Highway Safety Research Center and the United States Census Bureau, we’ve constructed the following maps to help you better understand North Carolina’s drunk driving landscape.
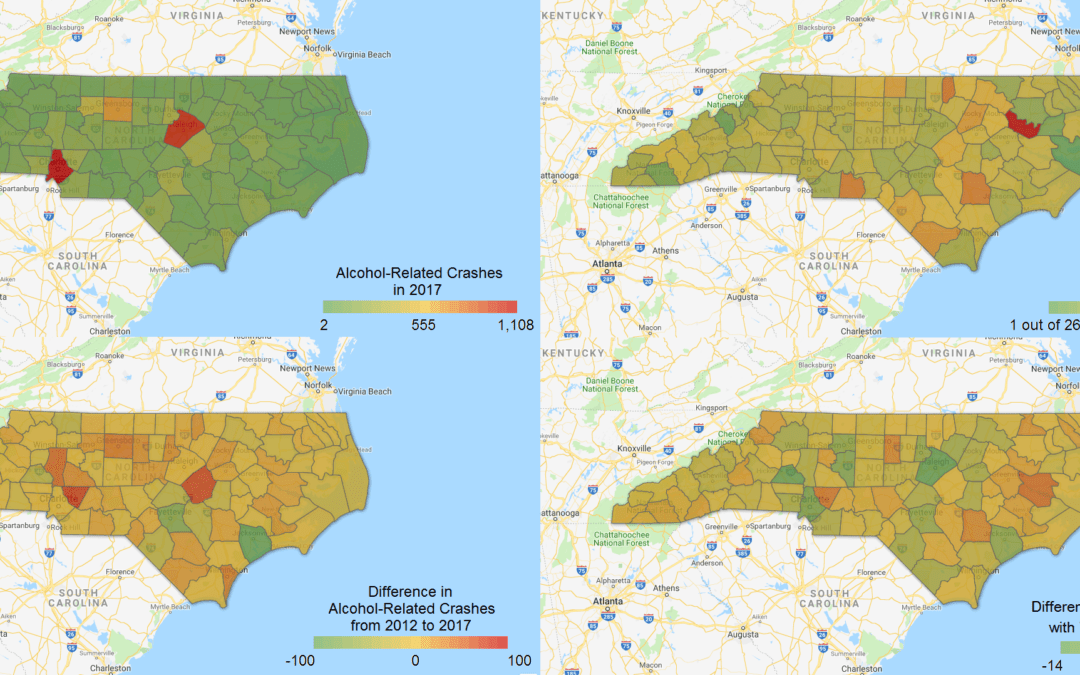
Number of Alcohol Related Crashes in 2017
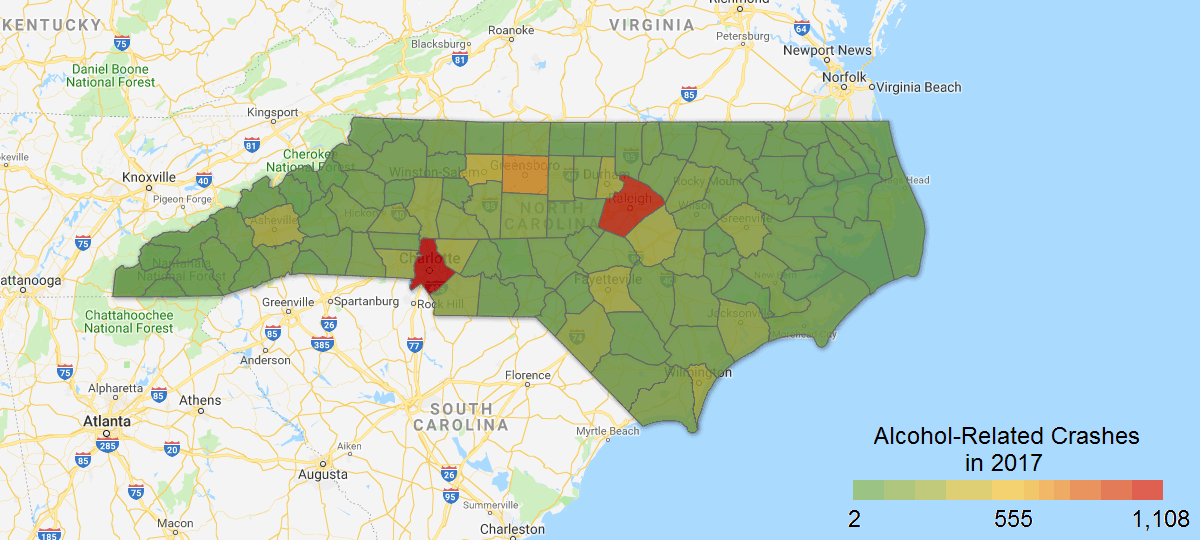
As might be expected, the most heavily populated counties have a much higher number of drunk driving accidents. Just how great the difference is may come as a surprise, however: in 2017, Mecklenburg County had 1,108 alcohol related crashes, while Hyde County had only 2.
Counties with Most Alcohol Related Crashes in 2017
- Mecklenburg – 1,108
- Wake – 993
- Guilford – 672
Counties with Least Alcohol Related Crashes in 2017
- Hyde – 2
- Tyrell – 5
- Washington – 7
Rate of Alcohol Related Crashes in 2017
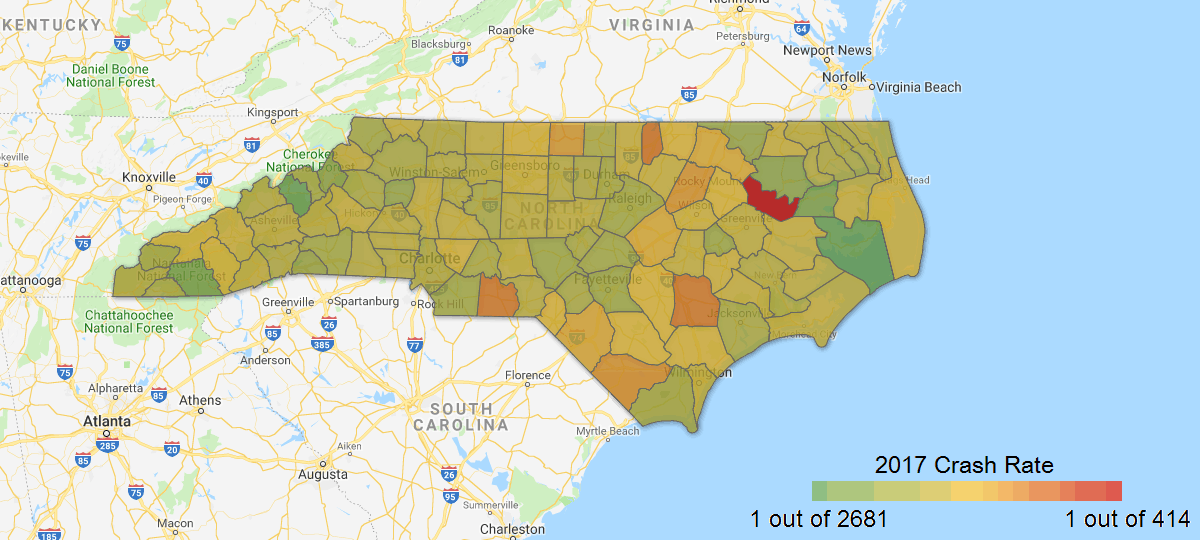
Another more significant statistic is the rate of alcohol related crashes, which throws the spotlight on counties with an unusually high or low number of crashes relative to their population. For example, in Hyde County there was only one alcohol related crash for every 2,681 residents, while Martin County had a much higher rate of one for every 414 residents.
Counties with the Highest Rate of Alcohol Related Crashes in 2017
- Martin – 1 out of every 414 people
- Vance – 1 out of every 560 people
- Duplin – 1 out of every 568 people
Counties with the Lowest Rate of Alcohol Related Crashes 2017
- Hyde – 1 out of every 2681 people
- Yancey – 1 out of every 2217 people
- Macon – 1 out of every 1737 people
5 Year Difference in Alcohol Related Crashes
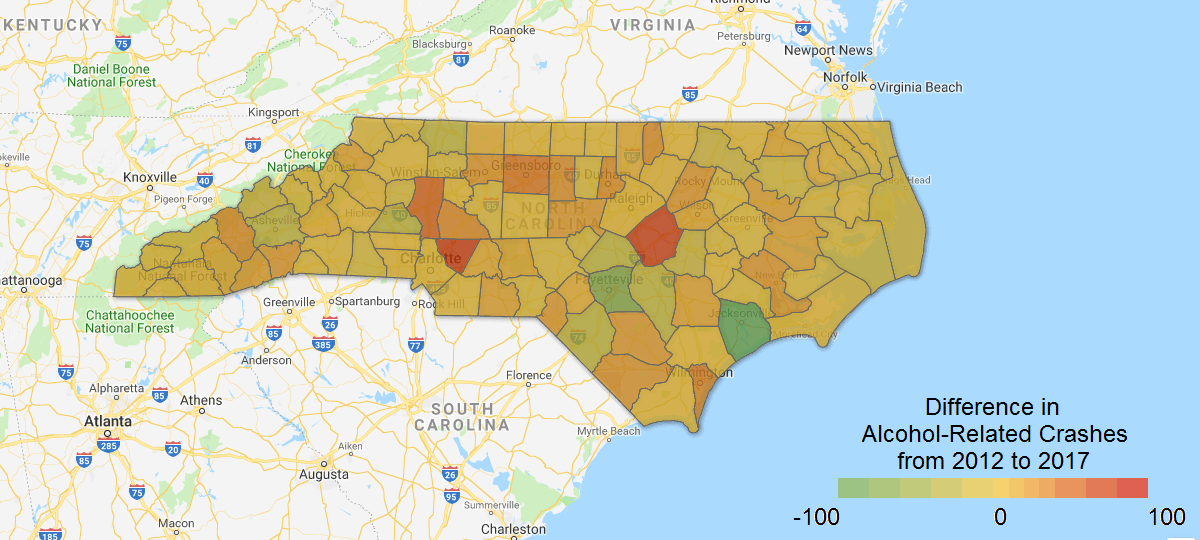
Identifying how counties have changed over several years can help show what policies have been effective in combating drunk driving, or what factors lead to an increase in alcohol-related crashes.
The data shows, for example, that while Jacksonville has been labeled North Carolina’s Drunkest City, the surrounding Onslow County has in fact seen the state’s largest decrease in alcohol-related crashes since 2012. Meanwhile, Cabarrus County’s alcohol-related crash count has increased seriously over the same time span.
Counties with the Greatest Decrease in Alcohol Related Crashes since 2012
- Onslow – a decrease of 99, from 290 to 191, bringing alcohol-related crash rate down to 1 in 1015.
- Cumberland – a decrease of 72, from 360 to 288, bringing alcohol-related crash rate down to 1 in 1155.
- Buncombe – a decrease of 31, from 323 to 292, bringing alcohol-related crash rate down to 1 in 882.
Counties with the Greatest Increase in Alcohol Related Crashes since 2012
- Cabarrus – an increase of 67, from 199 to 266, bringing alcohol-related crash rate up to 1 in 778.
- Johnston – an increase of 61, from 225 to 286, bringing alcohol-related crash rate up to 1 in 688.
- Iredell – an increase of 45, from 161 to 206, bringing alcohol-related crash rate up to 1 in 853.
5 Year Difference in Alcohol Related Crashes with Teen Drivers
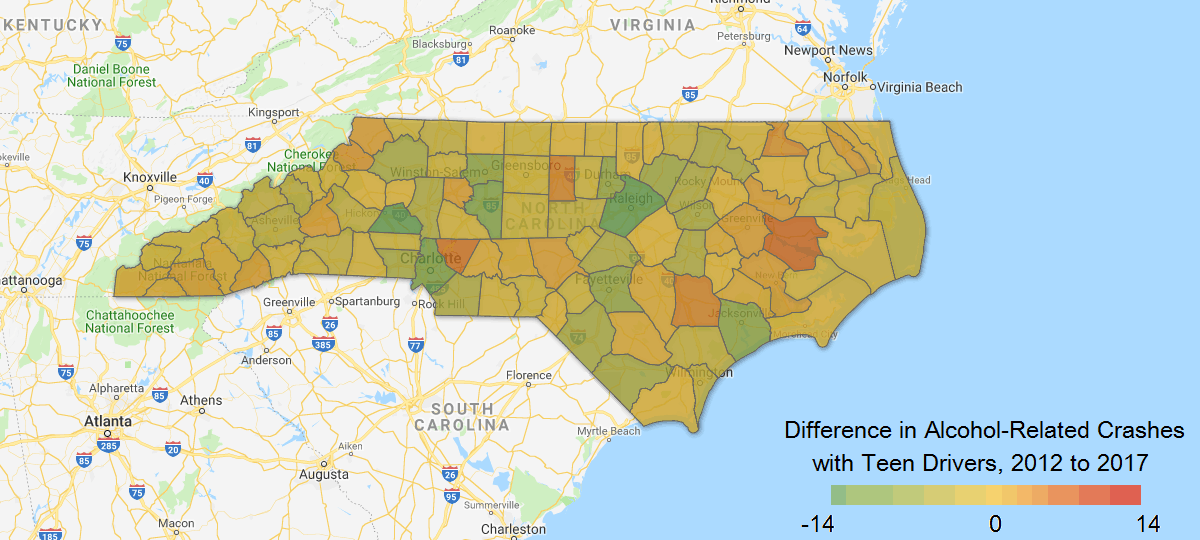
Alcohol-related crashes are even more serious when teen drivers are involved. Some of North Carolina’s counties have seen success in combating teen drinking and driving, while others have struggled. In 2017, Beaufort County had twice as many alcohol-related crashes with teen drivers than it did in 2012, while in Catawba County, the number of such crashes had been cut in half.
Counties with the Greatest Increase in Teen Driver Alcohol Related Crashes since 2012
- Beaufort – from 6 to 12. Teen drivers are now involved in 1 out of every 5 of Beaufort’s alcohol related crashes, up from 1 out of every 8 in 2012.
- Cabarrus – from 10 to 15. Teen drivers are now involved in 1 out of every 18 of Cabarrus’ alcohol related crashes, up from 1 out of every 20 in 2012.
- Duplin – from 4 to 8. Teen drivers are now involved in 1 out of every 13 of Duplin’s alcohol related crashes, up from 1 out of every 23 in 2012.
Counties with the Greatest Decrease in Teen Driver Alcohol Related Crashes since 2012
- Wake – from 88 to 74. Teen drivers are now involved in 1 out of every 13 of Wake’s alcohol related crashes, down from 1 out of every 11 in 2012.
- Catawba – from 26 to 13. Teen drivers are now involved in 1 out of every 14 of Catawba’s alcohol related crashes, down from 1 out of every 8 in 2012.
- Mecklenburg – from 80 to 69. Teen drivers are now involved in 1 out of every 16 of Mecklenburg’s alcohol related crashes, down from 1 out of every 14 in 2012.
Population Estimates from the United States Census Bureau.
Crash Data from Highway Safety Research Center at the University of North Carolina at Chapel Hill.